.svg)

The impact of financial crises
By Benjamin De Bruyne, Alejandro Marcos
Detecting the emergence of crises is of paramount importance in the financial sector. Although their occurrences are relatively exceptional, they lead to irreversible effects on our society. In the financial market more specifically, where uncertainty of a potential crisis creates an obnoxious atmosphere, traders tend to exhibit an irrational behavior that cascades into snowball effects, which, in turn, amplify the losses of the markets. For example, during the Great Recession in 2008-2009, the direct subprime losses were estimated to be a few hundred billion dollars that led to 5 trillion dollars losses in the world GDP and ultimately caused more than 25 trillion dollars losses in the global stock market [1]. Predictive data about a potential financial crash is an invaluable piece of information for financial institutions that could guide them in the period of an imminent crisis in order to avoid or at least to be prepared and mitigate drawdowns.
In order to address the fluctuating nature of markets, Gambit developed and operates a toolset called the “Seismograph”, whose goal is to help investors in their investment decisions. As part of the evolution of the Seismograph, the Gambit Data Science team is actively researching a crisis detection tool that could indicate the proximity of a financial crisis. Despite still being at an early stage, preliminary results already show evidence that such a tool may provide insightful information for an investor ahead of a crisis. Two major questions are under investigation:
- How likely is it that a crisis will happen soon?
- When is the most probable day for the crisis to start?
Gambit’s data scientists managed to create two predictive time signals that answer those two questions under the form of two separate signals. In order to achieve those results, the Data Science team studied and extended the work of a famous financial research center.
Financial bubbles
Despite the random nature of fluctuations in the stock market, it is possible to identify specific patterns that are uniquely observed prior to the emergence of a crisis. These patterns correspond to the super-exponential growth of the price. Such trends, observed over a long enough time period, are driven by the increased uncertainty and speculation amongst the actors in the financial world. These trends are unsustainable and inevitably yield to the crash of the stock market and are also commonly referred to as bubbles.
Fundamental academic research
This analysis is grounded in solid theoretical and empirical foundations laid by Prof. Didier Sornette and his group at the Financial Crisis Observatory based at ETH Zurich. Over the past two decades, Sornette et al. have studied a large range of financial bubbles from different origins, at different locations and different periods in time [2]. As these bubbles were catalysed by different events, there was a priori no reason to look for similarities amongst them. However, Sornette and his collaborators noticed that the market price in most bubbles followed the same kind of behaviour before the burst: a super exponential growth, which reflects the speculative character of a bubble, and log-periodic oscillations, that together forms the signature of collective irrational behaviour of financial agents in the presence of high uncertainty.
It might seem quite surprising at the beginning to observe similarities, but this is common to many systems close to their critical point. This concept, known as universality, has been widely studied in theoretical and applied science. The key idea is that regardless of the complexity of the system, it will exhibit a simple and universal behaviour close to its critical operating point.
One example of the success of such a concept is the detection of earthquakes which, regardless of their origin, share the same early warnings. Based on this idea, Sornette and his collaborators derived a theoretical model that encapsulates the universal trend of the price during the maturation of a financial bubble. This model, called the log-periodic power law singularity model (LPPLS), can be fitted on the historical market price evolution up to today and find out, based on the quality of the fit, if the market is currently in a bubble regime or not. This model has been applied on several historical bubbles and successfully predicted ex-ante notable crashes such as Black Monday, Dot-com, and the Subprime crisis [3].
From theory to practice
However, appealing as the model may look, its practical applicability is restrained by several factors. Indeed, the model suffers from numerical problems that cause instabilities, thus creating varying results that make the model hard to interpret. Furthermore, the model relies on many parameters whose values need to be determined upfront with no guarantee of being applicable to the current economic situation. Finally, complex calculations are needed in order to fit the model, thus increasing the difficulty of obtaining satisfactory results.
The data scientists at Gambit have overcome these hurdles using advanced optimization and machine learning techniques in order to create a robust and usable LPPLS signal, which represents the likelihood that the market is currently in a bubble state.
Additionally, the Data Science team extended the work of the Financial Crisis Observatory. Indeed, in addition to the LPPLS signal, the Data Scientists have engineered a signal to estimate the date for the crash to occur. This additional piece of information is crucial for our asset managers to take pre-emptive decisions and protect their portfolio from the potential subsequent losses. This signal is built using a machine learning technique that looks for a common agreement on the crash date amongst many LPPLS models based on the historical price evolution. Although still in an early development stage, the signal has already shown promising results on multiple back-tests.
The following figure shows the result of a back-test (an ex post analysis using historical data) carried out between 2018 and 2019. The uppermost graph shows the evolution of the S&P 500 price over the time period. Next, the middle graph shows the evolution of the crisis likelihood signal, while the lowermost graph shows the predicted number of days before the beginning of a crisis.
The confidence signal must be read as follows: the higher the value, the higher the confidence of the model that a crisis is going to happen in a near future. Regarding the number of days, a negative value indicates that the beginning of the crisis passed, while a positive value indicates that the crisis is yet to occur. As can be seen on the graph, the signals provide reasonable evidence of the presence of an imminent crisis and could have guided an investor at that time to adapt and improve his investment strategy. Very interestingly, the #days signal identifies the beginning of the crisis around Nov 2018 and then evolves linearly with time, which shows that the model is consistent in its predictions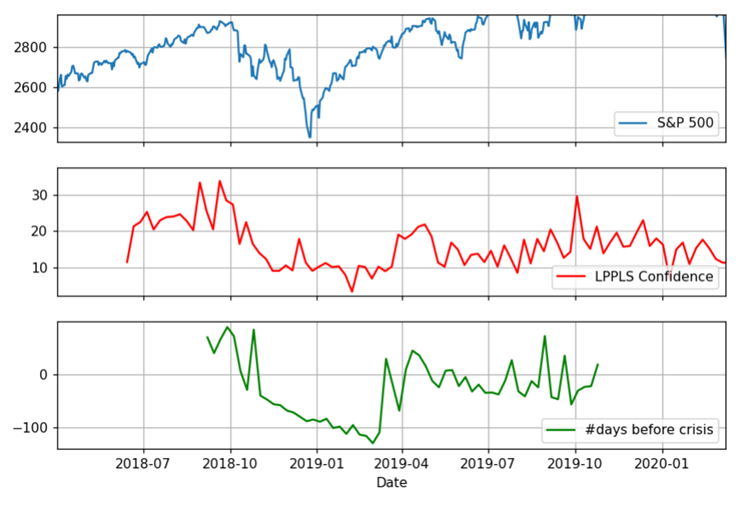
Outlook
Given the drastic consequences of a financial crisis, developing predictive tools to guide individual investors and asset managers in the imminence of a crisis is essential for financial institutions to stay ahead of the curve. While research on this topic at Gambit is still at a prototyping stage, it already shows promising results. The Gambit Data Science team will continue to develop this tool, among others, to offer our customers cutting-edge solutions to stay up to date with the evolution of the market.
[1] Sornette D., TEDGlobal 2013, https://www.ted.com/talks/didier_sornette_how_we_can_predict_the_next_financial_crisis?%5D
[2] A list of publications is available on their website: https://er.ethz.ch/media/publications/social-systems-finance/bubbles_and_crashes_theory_empirical_analyses.html
[3] https://papers.ssrn.com/sol3/papers.cfm?abstract_id=3076609